Hospital facilities & sustainability
SENGKANG GENERAL HOSPITAL
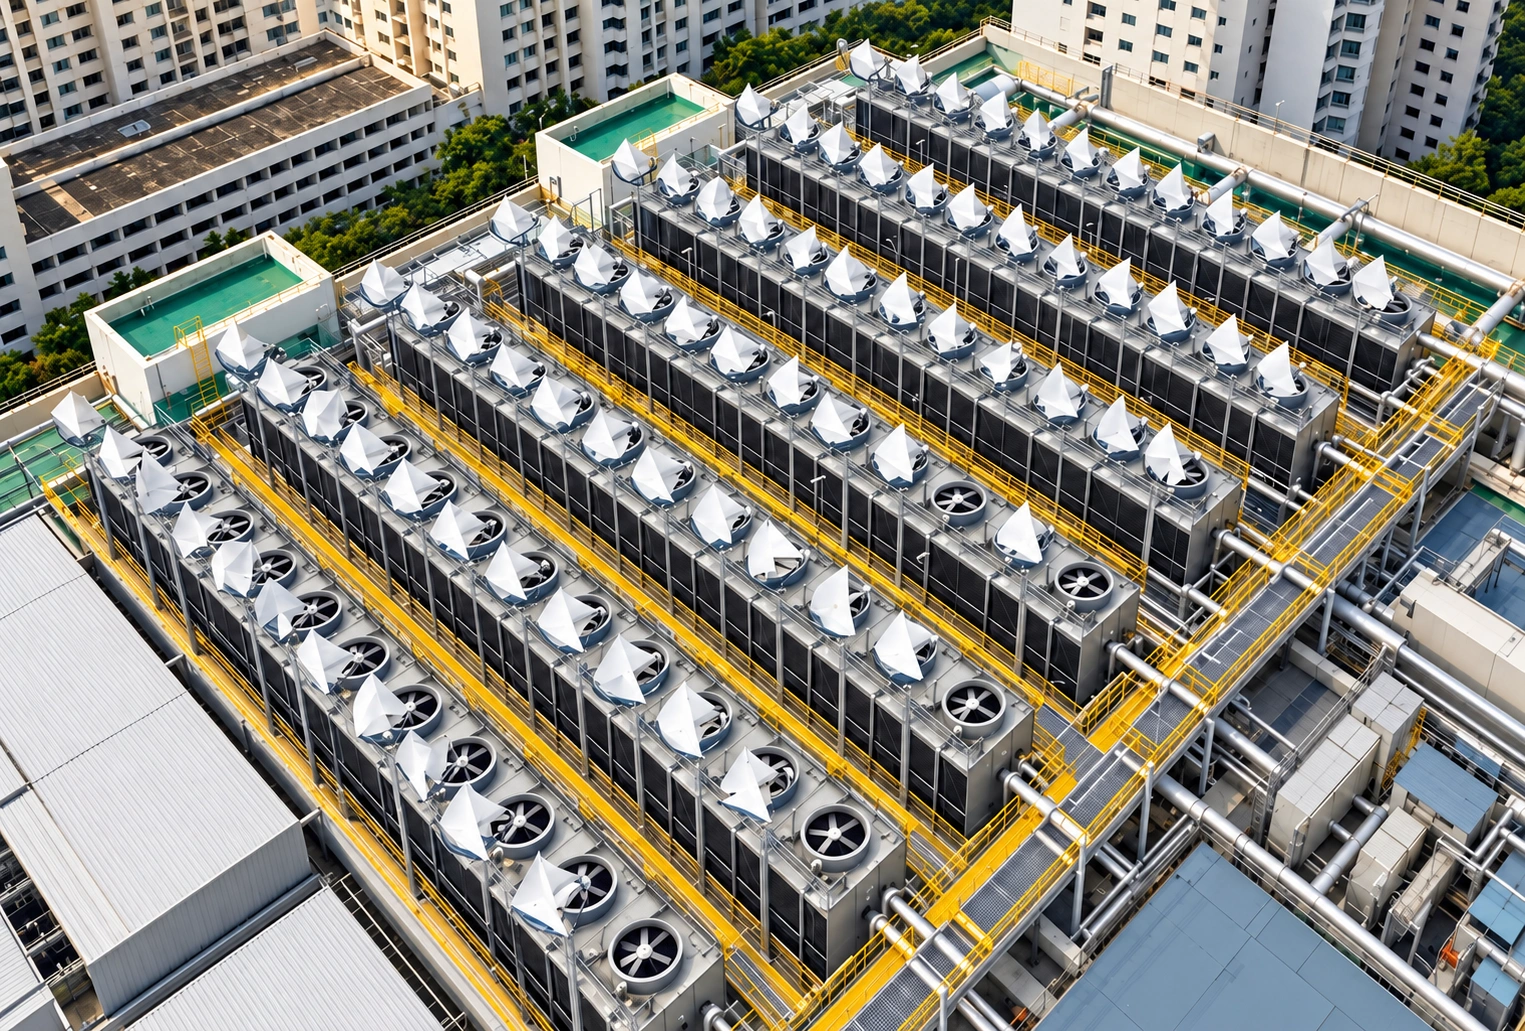
Cooling tower airflow.
Lower operating costs.
Put wasted cooling tower airflow to work with LIAM F1 R-1600 wind turbines, converting it into electricity to reduce hospital energy costs.
A measured pilot to assess rooftop airflow recovery, protect cooling performance and establish a credible investment case.
Prepared by Reliance Green Energy Pte Ltd
An operating-cost opportunity with a measured approval path
The proposal targets electricity cost reduction and progress toward hospital carbon neutrality goals through recovery of existing mechanical airflow.
Zero interference as a design objective
Use suitable space beside existing cooling towers. Preserve service routes, lifting zones, emergency access and any protected aviation clearances.
SGD 755,040 annual savings scenario
Validate savings against the hospital’s avoided electricity price, net generation and operating costs. Measured output can reduce exposure to electricity price changes.
Five-year payback target
Apply a proposed SGD 3.5 million capital cap. Full rollout proceeds only when the pilot supports the required net savings and technical acceptance criteria.
Site opportunity
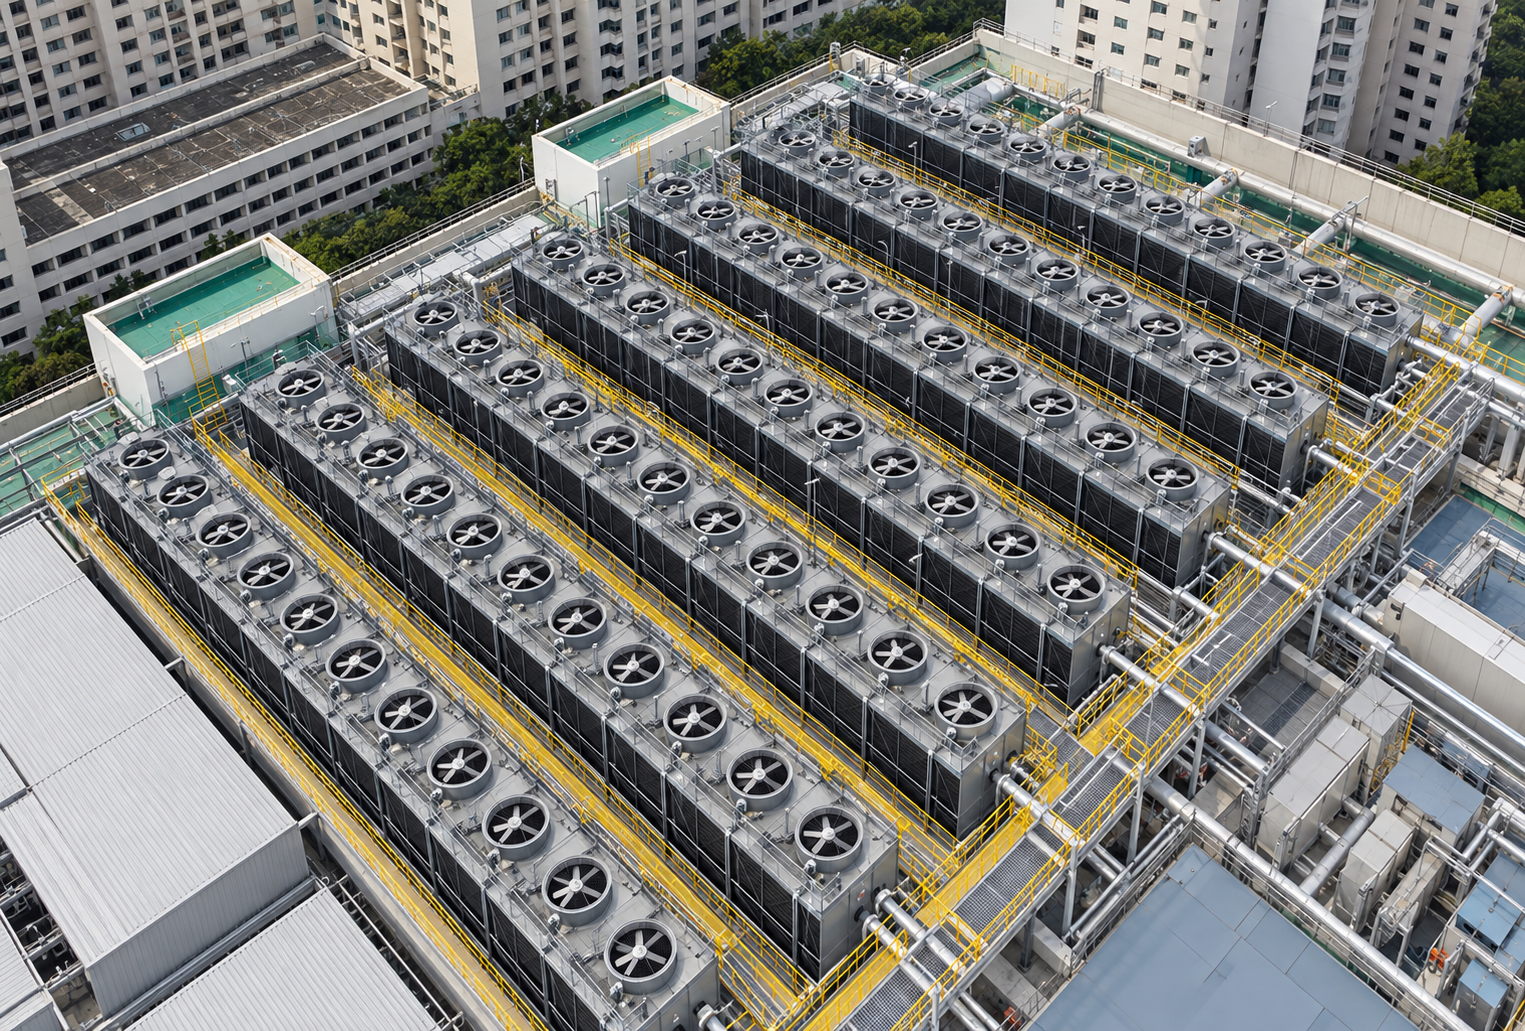
A consistent array beside the cooling towers
Proposed planning layout: seven rows of thirteen cooling tower outlets, with two turbines per cooling tower, giving 26 turbines per row.
- Confirm the actual fan count, outlet geometry and duty cycles during the survey.
- Locate independent supports beside the towers, with rotor alignment based on measured airflow.
- Maintain separation for safe access and future fan or motor replacement.
Two matching turbines beside each tower.
3D operating principle
How cooling tower airflow produces electricity
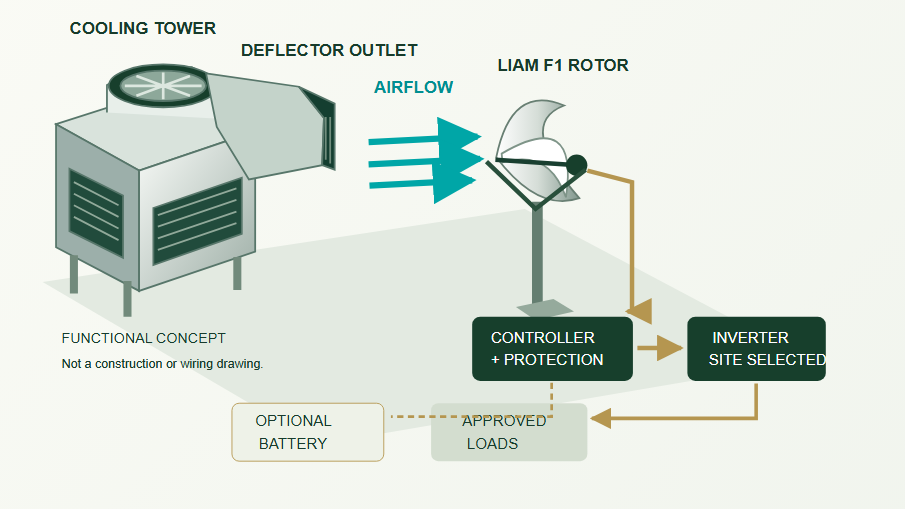
Airflow recovery
An engineered guide directs a portion of the tower’s discharge toward the rotor while preserving outlet clearance.
Rotation & generation
Airflow applies torque to the spiral blades. The horizontal shaft drives the generator.
Usable electricity
The controller and inverter condition the output for an approved connection to the building’s electrical system.
Conceptual arrangement. Net energy benefit includes any change in fan demand and system losses.
Technical validation
Net energy recovery with protected cooling performance
Cooling tower discharge provides the airflow source. The pilot must demonstrate the electrical benefit after any additional fan demand and system losses.
- Log airflow across fan speeds and representative plant loads.
- Measure turbine output alongside fan electricity, static pressure and cooling performance.
- Confirm structural loads, vibration, noise and maintenance clearances.
- Review electrical protection and integration with the hospital’s facilities team.
A visual simulation illustrates the concept. It does not verify generation or establish that cooling performance remains unchanged.
Solar & wind comparison
10 × 570 W solar panels vs. one LIAM F1 R-1600
Daily electricity output and savings using the supplied operating assumptions and SGD 0.22/kWh.
| No. | Parameter | 10 × 570 W solar panels | One LIAM F1 R-1600 turbine |
|---|---|---|---|
| 1 | Rated maximum power | 5,700 W | 5,050 W (supplied figure) |
| 2 | Assumed operating output | 1,425 W (25% of rated power) | 2,500 W (50% of nominal 5 kW) |
| 3 | Assumed daily operating hours | 4.5 peak sun hours | 24 airflow hours |
| 4 | Equipment cost | SGD 150 × 10 = SGD 1,500 | SGD 5,500 |
| 5 | Daily / annual electricity output | 6.4125 kWh/day 2,308.5 kWh/year | 60 kWh/day 21,600 kWh/year |
| 6 | Daily savings at SGD 0.22/kWh | SGD 1.41 | SGD 13.20 |
| 7 | Monthly savings | SGD 42.32 | SGD 396.00 |
| 8 | Annual savings | SGD 507.87 | SGD 4,752.00 |
| 9 | Equipment cost recovered in year 1 | 33.86% | 86.40% |
| 10 | Equipment cost remaining after year 1 | SGD 992.13 | SGD 748.00 |
| 11 | Estimated avoided CO₂ per year | 0.96 tonnes | 8.99 tonnes |
Note: solar-panel evaluation in Singapore
- Peak sun hours: approximately 4.0–4.5 hours/day annual average.
- Equivalent annual peak sun hours: approximately 1,460–1,640 hours/year.
- Practical PV yield: around 1,200–1,400 kWh per installed kWp per year, depending on roof orientation, shading, temperature, inverter losses, soiling and system availability.
Industrial feasibility calculator
Check Your Facility
Enter the number of cooling tower fans. This presentation sizes two turbines per fan and applies the R-1600 website’s annual yield preset to each turbine.
Per-turbine reference presets reproduced from the Reliance R-1600 calculator, checked 9 October 2026. Default: 91 fans × 2 turbines = 182 turbines.
This presentation uses two turbines per fan. The source website sizes one turbine per fan. Both use fixed annual-yield presets and 0.416 kg CO₂/kWh. Outlet dimensions and access do not change its numerical results. Its feasibility score is a preset, not an engineering certification. Estimates require site validation and do not account for incremental fan demand or losses.
Recommended array sizing
Estimated annual output
Carbon offset estimate
Tonnes CO₂ avoided / year, source-model basis
Turnkey scope & risk mitigation
A defined scope with hospital acceptance gates
| Scope | Proposal inclusion |
|---|---|
| Hardware | Turbines, controllers, inverters and monitoring |
| Installation materials | Supports, anchors, isolation, cabling and airflow guides where required |
| Installation & commissioning | Delivery, lifting, installation, protection tests and handover |
| Endorsement fees | PE and LEW services and applicable approval fees, itemised in the quotation |
| Safety compliance | Work permits, lifting plans, fall protection and hospital contractor requirements |
Final quotation must identify inclusions, exclusions, recurring costs and maintenance responsibility within the proposed capital cap.
Risk controls
- Cooling performance: compare pre- and post-installation plant measurements.
- Operational continuity: agree phased work windows and preserve hospital access.
- Structural safety: obtain design review before installation.
- Electrical integration: test protection and isolation before energising.
- Investment risk: apply measured net-output and savings thresholds before rollout.
Installation at Infineon Technologies, Singapore
Site survey & pilot approval
The next decision is a measured pilot
Approve access for a site survey and preparation of a costed pilot proposal. Full-array investment follows technical and financial acceptance.
Site survey
Confirm outlet inventory, operating schedules, airflow, support locations and access constraints.
Pilot proposal
Agree turbine positions, installation scope, programme, measurement plan and acceptance thresholds.
Pilot approval
Review itemised cost, professional endorsements and hospital safety requirements before installation.
Rollout decision
Use measured net energy and operating costs to test the five-year payback target and SGD 3.5 million cap.